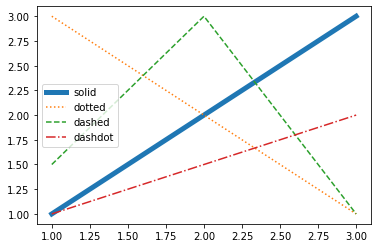
折れ線グラフの線の幅・種類
線の幅の指定はlinewidth引数指定、linestyleで線の種類(破線・点線etc)などを指定できます。
import matplotlib.pyplot as plt
x = [1, 2, 3]
y1 = [1, 2, 3]
y2 = [3, 2, 1]
y3 = [1.5, 3, 1]
y4 = [1, 1.5, 2]
y5 = [2, 2, 2]
plt.plot(x, y1, linestyle='solid', linewidth=5, label='solid')
plt.plot(x, y2, linestyle='dotted', label='dotted')
plt.plot(x, y3, linestyle='dashed', label='dashed')
plt.plot(x, y4, linestyle='dashdot', label='dashdot')
plt.legend()
plt.show()